Today I updated to the latest Nextcloud docker container, as there were massive problems with the encryption app in previous versions. User couldn’t login and file versions could not be opened… Read more about it in the following two issues:
Allthough some users reported, that they still have issues, I tried the latest version. Luckily, in my case the update finished without issues and it solved all my problems related to the encryption app.
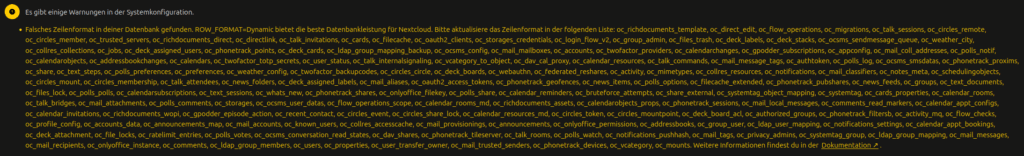
Falsches Zeilenformat in deiner Datenbank gefunden. ROW_FORMAT=Dynamic bietet die beste Datenbankleistung für Nextcloud. Bitte aktualisiere das Zeilenformat in der folgenden Liste: oc_richdocuments_template, oc_direct_edit, oc_flow_operations, oc_migrations, oc_talk_sessions, oc_circles_remote, oc_circles_member, oc_trusted_servers, oc_richdocuments_direct, oc_directlink, oc_talk_invitations, oc_cards, oc_filecache, oc_oauth2_clients, oc_storages_credentials, oc_login_flow_v2, oc_group_admin, oc_files_trash, oc_deck_labels, oc_deck_stacks, oc_ocsms_sendmessage_queue, oc_weather_city, oc_collres_collections, oc_jobs, oc_deck_assigned_users, oc_phonetrack_points, oc_deck_cards, oc_ldap_group_mapping_backup, oc_ocsms_config, oc_mail_mailboxes, oc_accounts, oc_twofactor_providers, oc_calendarchanges, oc_gpodder_subscriptions, oc_appconfig, oc_mail_coll_addresses, oc_polls_notif, oc_calendarobjects, oc_addressbookchanges, oc_calendars, oc_twofactor_totp_secrets, oc_user_status, oc_talk_internalsignaling, oc_vcategory_to_object, oc_dav_cal_proxy, oc_calendar_resources, oc_talk_commands, oc_mail_message_tags, oc_authtoken, oc_polls_log, oc_ocsms_smsdatas, oc_phonetrack_proxims, oc_share, oc_text_steps, oc_polls_preferences, oc_preferences, oc_weather_config, oc_twofactor_backupcodes, oc_circles_circle, oc_deck_boards, oc_webauthn, oc_federated_reshares, oc_activity, oc_mimetypes, oc_collres_resources, oc_notifications, oc_mail_classifiers, oc_notes_meta, oc_schedulingobjects, oc_circles_mount, oc_circles_membership, oc_talk_attendees, oc_news_folders, oc_deck_assigned_labels, oc_mail_aliases, oc_oauth2_access_tokens, oc_phonetrack_geofences, oc_news_items, oc_polls_options, oc_filecache_extended, oc_phonetrack_pubshares, oc_news_feeds, oc_groups, oc_text_documents, oc_files_lock, oc_polls_polls, oc_calendarsubscriptions, oc_text_sessions, oc_whats_new, oc_phonetrack_shares, oc_onlyoffice_filekey, oc_polls_share, oc_calendar_reminders, oc_bruteforce_attempts, oc_share_external, oc_systemtag_object_mapping, oc_systemtag, oc_cards_properties, oc_calendar_rooms, oc_talk_bridges, oc_mail_attachments, oc_polls_comments, oc_storages, oc_ocsms_user_datas, oc_flow_operations_scope, oc_calendar_rooms_md, oc_richdocuments_assets, oc_calendarobjects_props, oc_phonetrack_sessions, oc_mail_local_messages, oc_comments_read_markers, oc_calendar_appt_configs, oc_calendar_invitations, oc_richdocuments_wopi, oc_gpodder_episode_action, oc_recent_contact, oc_circles_event, oc_circles_share_lock, oc_calendar_resources_md, oc_circles_token, oc_circles_mountpoint, oc_deck_board_acl, oc_authorized_groups, oc_phonetrack_filtersb, oc_activity_mq, oc_flow_checks, oc_profile_config, oc_accounts_data, oc_announcements_map, oc_mail_accounts, oc_known_users, oc_collres_accesscache, oc_mail_provisionings, oc_announcements, oc_onlyoffice_permissions, oc_addressbooks, oc_group_user, oc_ldap_user_mapping, oc_notifications_settings, oc_calendar_appt_bookings, oc_deck_attachment, oc_file_locks, oc_ratelimit_entries, oc_polls_votes, oc_ocsms_conversation_read_states, oc_dav_shares, oc_phonetrack_tileserver, oc_talk_rooms, oc_polls_watch, oc_notifications_pushhash, oc_mail_tags, oc_privacy_admins, oc_systemtag_group, oc_ldap_group_mapping, oc_mail_messages, oc_mail_recipients, oc_onlyoffice_instance, oc_comments, oc_ldap_group_members, oc_users, oc_properties, oc_user_transfer_owner, oc_mail_trusted_senders, oc_phonetrack_devices, oc_vcategory, oc_mounts. Weitere Informationen findest du in der Dokumentation ↗.
For all these tables a row format adjustment was required. I used ChatGPT to generate the ALTER TABLE commands for all tables that were mentioned in the warning and used the following commands to enter the MariaDB Container:
After a refresh in the NC webinterface, all warnings were gone.