
When opening the Dev-Tools for a deployed Fiori App, it will look like this:
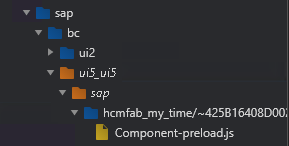
You won’t see any controller.js to debug.
What to do? Close the Debugger-Tools and hit CTRL+ALT+SHIFT+P to open the Technical Information Dialog
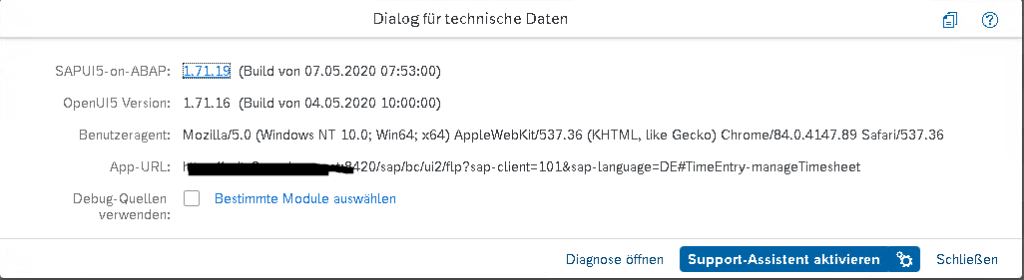
Check the Checkbox (or choose a specific controller) and reload the app.
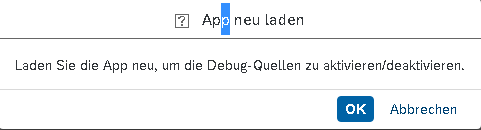

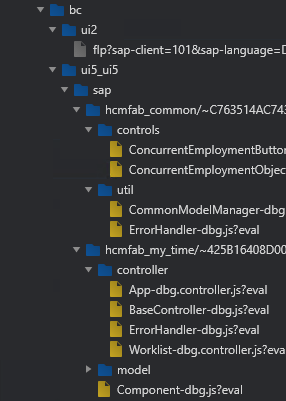
It reloads with a new URL parameter and if you open the Dev-Tools, you will now see the controller.js.
Other options to debug or at least to collect some information about your app are the UI5 Diagnostics (hit CTRL+ALT+SHIFT+S) and the UI5 Inspector which is a Browser Addon.